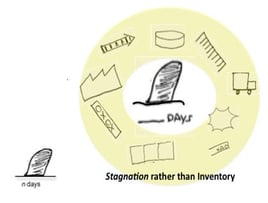
Twenty years ago, I was introduced to a graphical method for, as it was put to me, “sharing what you see” with others. It was referred to as a material and information flow diagram, or M&I for short. Brian S., a consultant from TSSC who was assisting my factory, pointed to a diagram he had sketched earlier in the day and said “This is how we see the current condition of line X and I’d like to confirm it with you before we proceed.” I gazed at the drawing, a little reminiscent of a process map, but with symbols like striped arrows, and starbursts and, in particular, headstones.
“Headstones!” I exclaimed to Brian, “What do they represent?”
"Stagnation”, he replied, “of either material or information.” He continued, “like stagnant water: not flowing, smelly, a bad thing.” He pointed to a process box labeled ‘Assembly.’ “See here, there are eight days of queue in front of assembly,” he said. “That’s stagnation.”
The power of this graphically explicit M&I tool was immediately apparent. At a glance, the entire process condition from incoming purchased material to customer shipment was far more obvious. I studied the diagram, staring alternately at the piles of WIP on the actual floor and then back at the headstones before each process box on the M&I. “Hmm,” I answered as I summed up the days of inventory, “this looks like cumulatively about fifty-six days of inventory in queue across the entire process. Or should I call it “stagnation?”
“Call it inventory if you like, but it’s stagnating together with the associated production orders,” Brian answered.
“When will you teach me more about this M&I tool?” I asked.
“Wait a little,” Brian responded. “We’ll show you more when we think you’re ready.”
About a year after this early lesson, Learning to See was published, introducing the world to Value Stream Mapping (VSM). Perhaps the most significant technical method in the last 20 years, VSM has created the opportunity for its practioners to “see” their workplaces in a new way. Today the prescriptive VSM symbology, nearly identical to that in TSSC’s M&I method, has been copied into hundreds of derivative value stream mapping books and can be seen on the walls of factories, offices and clinics around the world. I wonder, however, why the judgmental headstone (stagnation) was replaced by a more nondescript triangle symbol (inventory) when the ideas were translated from Toyota to the rest of us.
“You can make your own symbols up,” Brian S. told me at a later time, “as long as you all understand what they mean.” But I think I’ll stick with the headstone rather than the triangle. Because fear of reducing inventory continues to be one of the biggest problems lean implementers face today, let’s make it as ugly as possible.
How about at your facility? Is it inventory or stagnation? I'd love to hear from you.
O.L.D.
BTW – There’s still time to sign up from my next free webinar on Tuesday, January 14, 3:00-3:45 p.m. EST. The topic is Value Stream Mapping: Mistakes and Faux Pas. Hope you can join me. Click here to read more and register.

